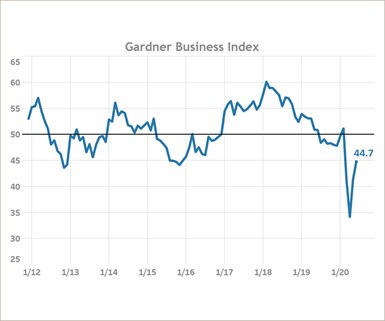
Gardner Business Index Reading of 44.7 for June 2020
The June data indicate that a shrinking proportion of manufacturers experienced worsening conditions and a growing proportion experienced unchanging or improving conditions relative to May. Recent activity reported by broad economic indicators of the economy including a rebound in consumption spending and a precipitous drop in weekly initial claims for unemployment since late March support the impression that the economy is nearing the ‘bottom’ of the decline caused by the initial costs brought on by COVID-19.
#economics

June’s Gardner Business Index (GBI) reading of 44.7 brought the GBI closer to a reading of ‘50’ for a second month of slowing decline in manufacturing.
RELATED CONTENT
-
Mazda, CARB and PSA North America: Car Talk
The Center for Automotive Research (CAR) Management Briefing Seminars, an annual event, was held last week in Traverse City, Michigan.
-
Report Forecasts Huge Economic Upside for Self-Driving EVs
Widespread adoption of autonomous electric vehicles could provide $800 billion in annual social and economic benefits in the U.S. by 2050, according to a new report.
-
On Urban Transport, the Jeep Grand Wagoneer, Lamborghini and more
Why electric pods may be the future of urban transport, the amazing Jeep Grand Wagoneer, Lamborghini is a green pioneer, LMC on capacity utilization, an aluminum study gives the nod to. . .aluminum, and why McLaren is working with TUMI.

