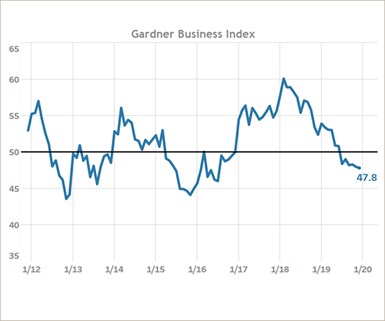
December Gardner Business Index Shows Improved Business for Larger Firms
While the Gardner Business Index ended 2019 with a year low reading of 47.8, certain sectors of the manufacturing industry continue to impress; one must simply know where to look. Gardner Intelligence’s review of the underlying data for the month observed that the Index – calculated as an average of its components – was lifted by expanding activity in supplier deliveries and modestly contracting activity in new orders, employment and exports. The Index was pulled lower by production and backlog readings which reported quickening contraction. Among the over 20 end markets tracked by Gardner, five stood out during 2019.
#economics

RELATED CONTENT
-
On Quantum Navigation, EVs, Auto Industry Sales and more
Sandia’s quantum navi, three things about EVs, transporting iron ore in an EV during the winter, going underwater in an EV (OK, it is a sub), state of the UK auto industry (sad), why the Big Three likes Big Vehicles, and the future of logistics.
-
Fuel Economy Gains in July
What you’re looking at here is a sales-weighted fuel economy chart (the numbers in the white boxes represent miles per gallon) that was put together by two diligent researchers, Michael Sivak and Brandon Schoettle, of the University of Michigan Transportation Research Institute.
-
Ford’s $42 Billion Cash Cow
F-Series pickups generate about 30% of the carmaker’s revenue. The tally is about twice as much as what McDonald’s pulls in.

