Big Increase Projected for "Green" Hydrogen
Annual investments to surpass $1 billion by 2023
#economics
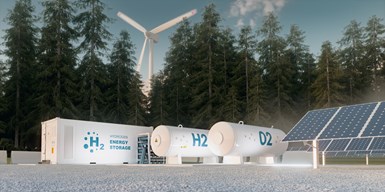
Global production capacity of hydrogen generated from renewable resources is expected to grow from 82 MW today to 23 GW by 2030, according to IHS Markit.
If you’re not familiar with the difference between mega- and gigawatts, this may not sound like much.
But it’s actually a seismic jump, representing a 280-fold increase over the next decade.
Why It Matters

Getty Images
Increased hydrogen production is necessary to support the growing demand for fuel cell-powered vehicles (especially commercial trucks) and, to a lesser extent, hydrogen-fueled ICE-powered models.
So-called “green hydrogen” reduces the manufacturing carbon footprint as well as tailpipe emissions. The carbon neutral process uses renewable sources (wind, solar and water) to power electrolyzers that split water into hydrogen and oxygen, rather than deriving hydrogen from natural gas.
Building the Pipeline
The production forecast isn’t a pie-in-the-sky, rosy outlook or best-case scenario.
IHS says the new hydrogen pipeline is based on projects already announced, planned and under construction. Worldwide annual investments in such manufacturing capability are expected to surpass $1 billion by 2023, the forecasting firm says.
Cost Parity
The rapid increase is attributed to government incentives and significant cost reductions.
IHS says production costs for green hydrogen have fallen by 40% since 2015 and are expected to drop another 40% through 2025. To date, the savings have been driven by reduced costs or renewable power sources—solar, wind and water—which have provided two-thirds of the reductions since 2015.
The other one-third stems from reductions in the cost of the electrolysis equipment. Further improvements in this area are expected over the next decade, which IHS predicts will allow green hydrogen costs to drop below $2/kg.
This will make costs for hydrogen produced from renewable resources competitive with hydrogen derived from natural gas, according to the forecasting firm.
The $2/kg cost point is the “holy grail” for electrolysis where “green hydrogen starts becoming competitive with traditional hydrogen” attests Soufien Taamallah, IHS’ director of energy technologies and hydrogen.
Giga Production
Investments in electrolysis are booming around the world with multiple “giga-factories” under development, IHS says, thanks in part to post-COVID recovery plans and long-term government climate strategies.
The company notes that Chile, Russia and several European countries have released new hydrogen strategies in the last six months that detail plans to increase low-carbon hydrogen and investments for electrolysis-based manufacturing.
What’s Next?
Several companies have announced new projects in recent months.
Porsche and Siemens Energy (in conjunction with three energy firms) are building a pilot plant in Chile that they claim will be the world’s first integrated industrial-scale plant for the development of what they call “e-fuels,” including green hydrogen.
Oil giant BP, meanwhile, is planning a 50-MW electrolyzer in Germany that will be powered by an Orsted windfarm in the North Sea.
Such projects will create a new sector of power demand, with electricity supplied to electrolyzers equaling the overall consumption of New Jersey or Belgium by the mid-2020s, IHS says. And by the early-2040s, production of green hydrogen could become the single largest use of electricity, the forecasting firm predicts.
RELATED CONTENT
-
What Suppliers Need to Know Right Now
This is a time of reckoning for the auto industry, says Paul Eichenberg. He has some recommendations as to how companies can make their way through it.
-
Report Forecasts Huge Economic Upside for Self-Driving EVs
Widespread adoption of autonomous electric vehicles could provide $800 billion in annual social and economic benefits in the U.S. by 2050, according to a new report.
-
Is The V8 Dead?
Tougher fuel economy standards may be the end of most V8s.


